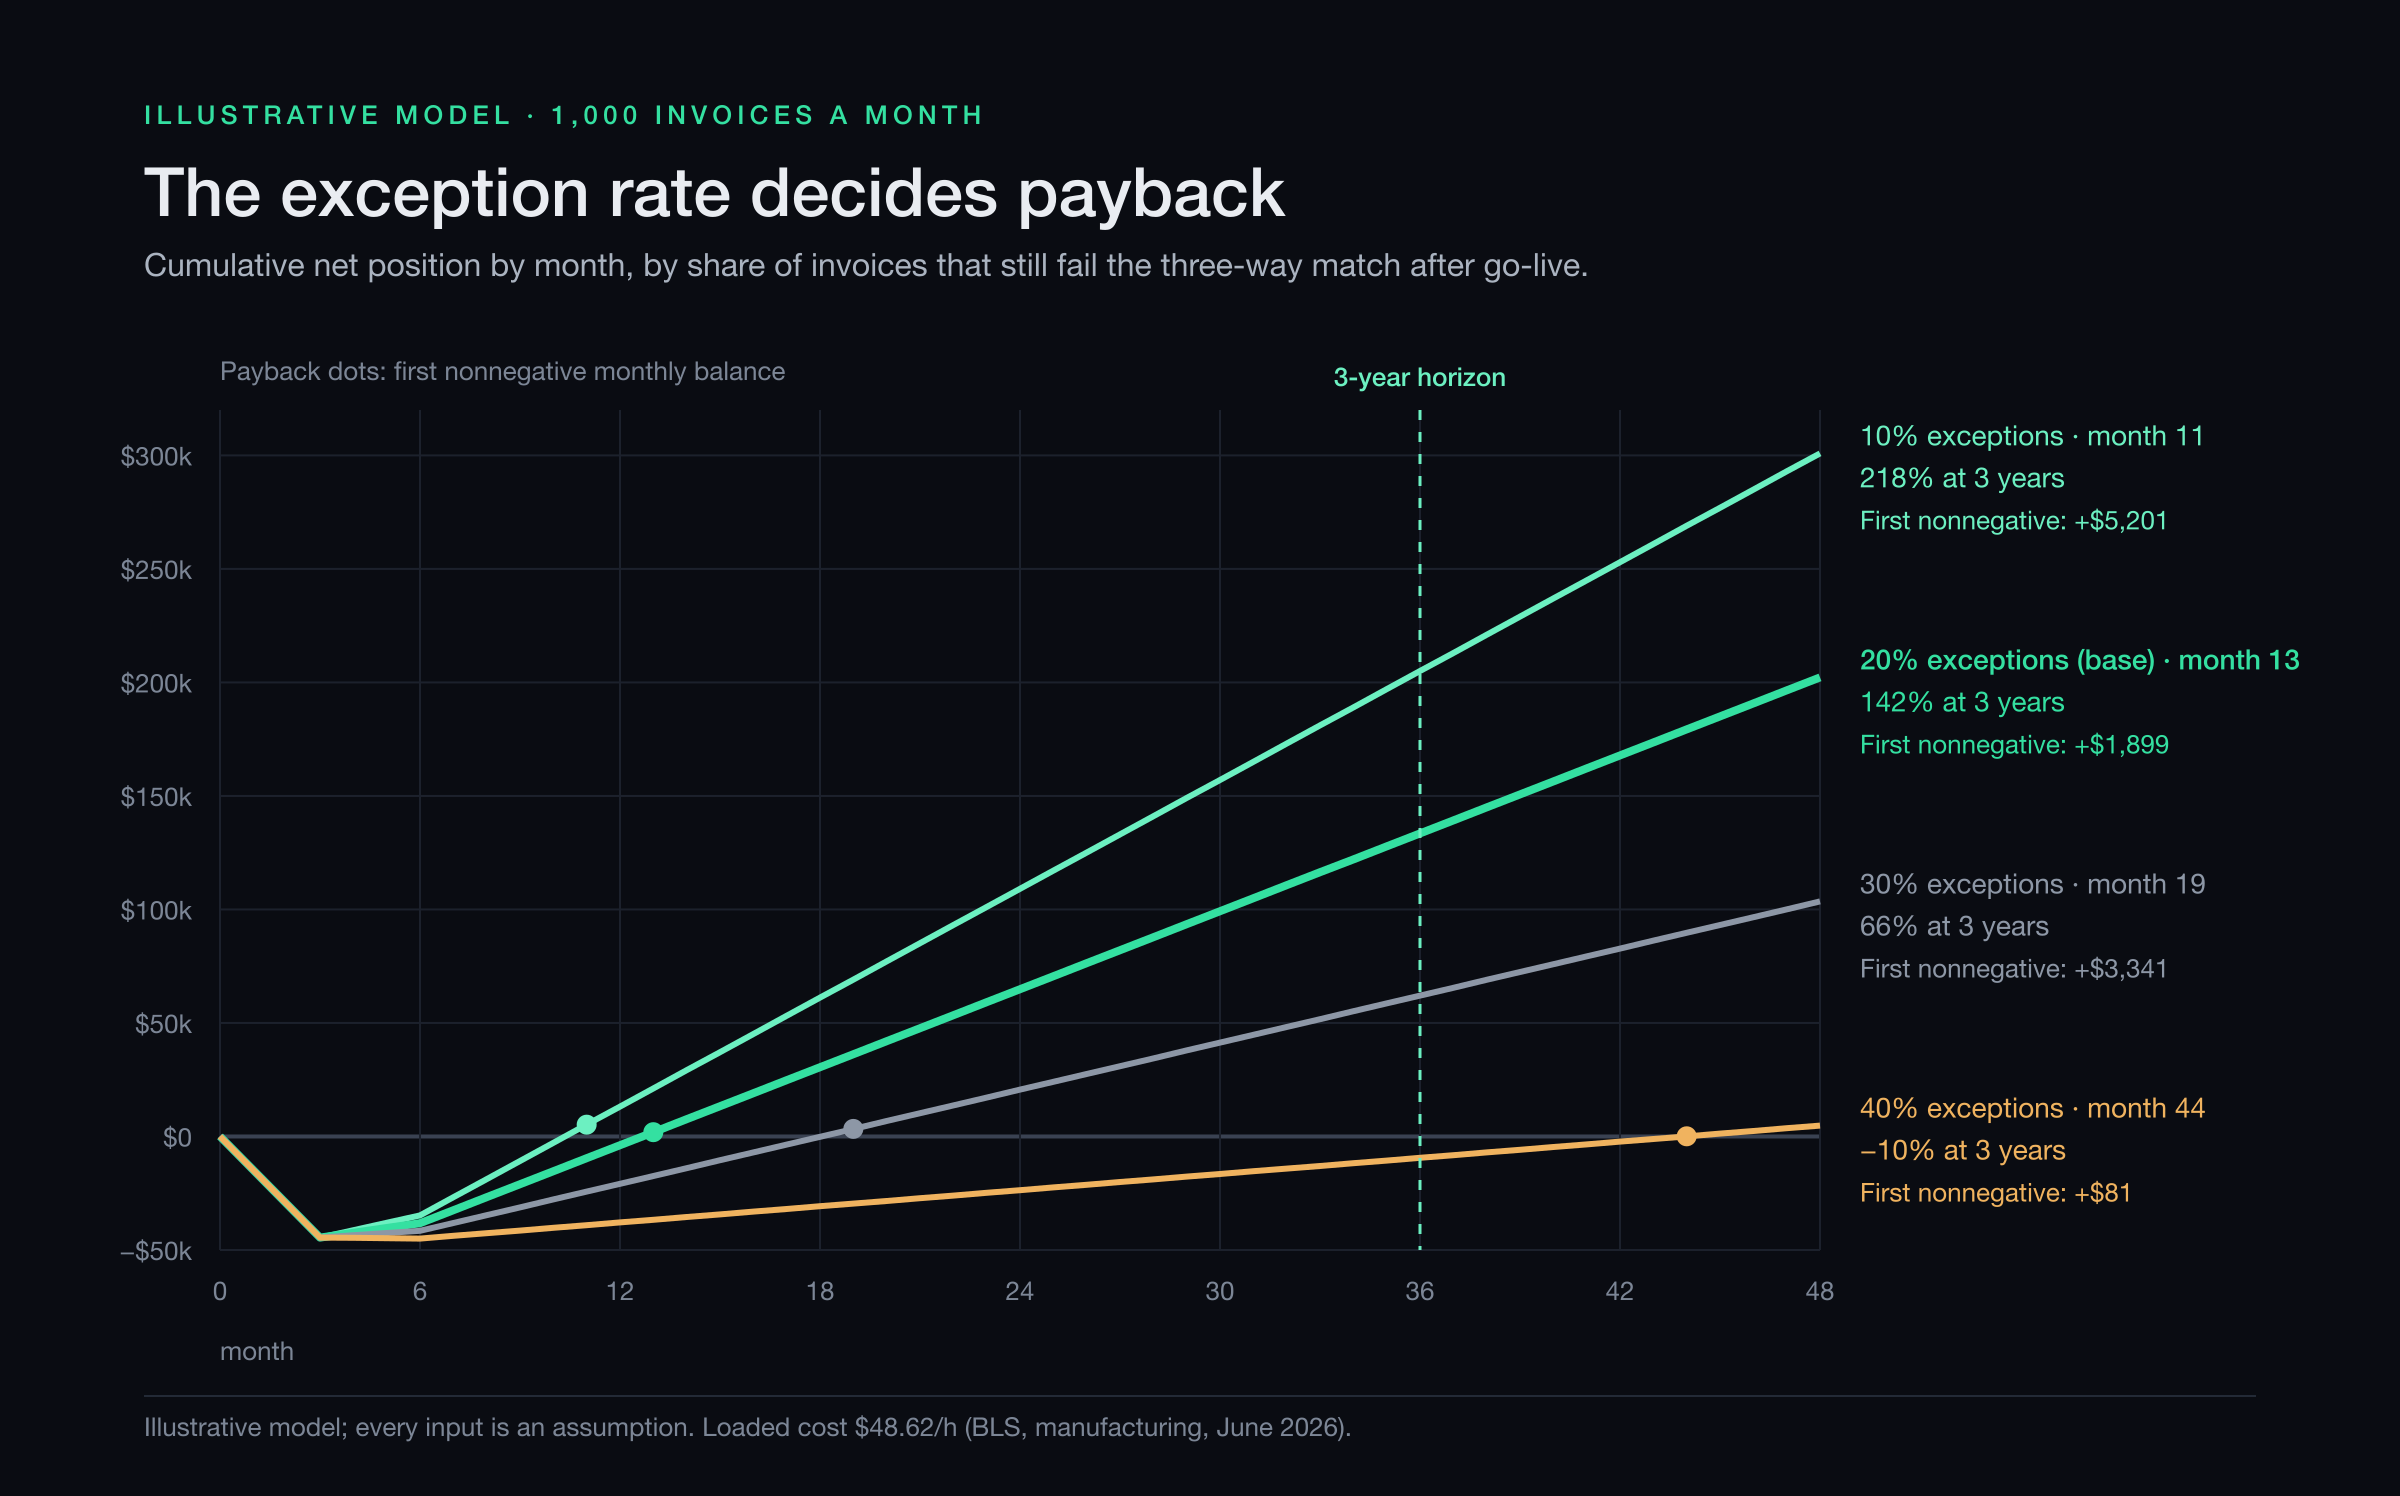
One input decides the payback of accounts payable (AP) automation: the share of invoices that still fail the three-way match after go-live. Software clears clean invoices; each failed match waits for a person. In the illustrative model below, payback comes in month 13 when 20% fail, month 11 at 10% and month 44 at 40%. Three-year return on investment (ROI) falls from 218% to −10% across that range.
The model behind the chart
Three-way match pays a supplier only when three records agree. The purchase order (PO) says what you ordered and at what price. The goods receipt, posted at the receiving dock, says what arrived. The invoice says what the supplier wants to be paid for.
In 3-way match automation, software reads each invoice, checks it against the PO and the receipt, and sends only the mismatches to a person. That is the document processing we cover under AI automation for manufacturing operations. Any accounts payable automation ROI model then comes down to a few lines:
e                       = share of invoices that fail the three-way match
Minutes per invoice     = (1 − e) × clean-invoice minutes + e × exception minutes
Cost per invoice        = minutes per invoice × loaded hourly cost ÷ 60
Labor savings a year    = invoices a year × (cost per invoice today − cost after go-live)
Full savings a month    = (labor savings a year + extra discounts a year) ÷ 12
Savings in month m      = none in months 1–3, half in months 4–6, full from month 7
Cumulative net, month m = savings to date − running cost to date − one-time cost paid to date
Payback month           = first month the cumulative net is above zero
3-year ROI              = cumulative net at month 36 ÷ (one-time cost + 36 months of running cost)
The exception rate e enters twice, for today and for after go-live. You can measure today’s rate; the rate after go-live is a forecast and the only input the chart varies. Count only people time in both cost-per-invoice figures, and put software fees in the running cost. The month-by-month method is explained in how to calculate workflow automation ROI.
The base case: inputs and results
Example (illustrative): a 150-person plant machines and assembles hydraulic parts. Two AP clerks key its PO-backed supplier invoices for bar stock, castings, fasteners, plating and freight into the enterprise resource planning (ERP) system. Every number below is an assumption, so replace it with yours.
| Input | Assumption |
|---|---|
| Invoices | 1,000 PO-backed invoices a month (12,000 a year) |
| Exception rate | 20% today; 20% after go-live in the base case |
| Minutes today | 10 per clean invoice, 40 per exception |
| Minutes after go-live | 2 per clean invoice (spot-check and post), 30 per exception |
| Loaded hourly cost | $48.62: total compensation per hour worked in manufacturing, June 2026, from the U.S. Bureau of Labor Statistics (BLS)1 |
| Early-payment discounts | 2% for paying in 10 days instead of 30, on $500,000 of spend; capture rises from 25% to 75% |
| One-time cost, months 1–3 | $40,000: setup and ERP integration $26,000, vendor master cleanup $6,000, supplier onboarding $4,000, training $4,000 |
| Running cost from month 1 | $1,500 a month: subscription, usage fees and upkeep of match rules |
| Ramp-up, months 4–6 | Half the full savings |
| Freed hours | Cover growth that would otherwise need a third clerk |
Today the desk spends 16 minutes per invoice (0.8 × 10 + 0.2 × 40), or $12.97 at the loaded rate. After go-live it spends 7.6 minutes, or $6.16. The 1,680 hours saved a year (3,200 down to 1,520) are worth $81,682. Add $5,000 of extra discounts, subtract $18,000 of running cost, and the plant gains $68,682 a year at full speed.
The cumulative net bottoms out at −$44,500 in month 3, when the build is paid. It is −$38,165 when ramp-up ends in month 6 and −$3,824 at month 12, then turns positive in month 13 (+$1,899). At month 36 it reaches +$133,539, against $94,000 of total cost ($40,000 once plus 36 months at $1,500): a 3-year ROI of 142%.
Ardent Partners’ 2025 benchmark of AP departments puts the average exception rate at 18.4%, close to the 20% assumed here.2 Its average invoice processing cost is $9.84, below this desk’s $12.97. The Best-in-Class group, the 20% of enterprises with the lowest costs and shortest cycle times, spends 79% less per invoice than its peers and processes invoices 79% faster.2
Three inputs need care. The BLS rate averages all manufacturing workers; if your clerks cost less, labor savings shrink in proportion. Paying 20 days early for 2% earns about 37% a year on that cash (2 ÷ 98 × 365 ÷ 20), so count discounts only if you have the cash.
The freed hours count as cash only because they replace a planned hire. If they replace no hire, overtime or temp, you have bought capacity, not cash.
Sensitivity: what each lever does to payback
| One change from the base case | Payback month | Payback shift | 3-year ROI |
|---|---|---|---|
| None: 20% exceptions after go-live | 13 | — | 142% |
| Exceptions after go-live: 10% | 11 | 2 months sooner | 218% |
| Exceptions after go-live: 30% | 19 | 6 months later | 66% |
| Exceptions after go-live: 40% | 44 | 31 months later, past the 3-year horizon | −10% |
| One-time cost +50% ($60,000) | 17 | 4 months later | 100% |
| Running cost +50% ($2,250 a month) | 15 | 2 months later | 88% |
| No early-payment discounts | 14 | 1 month later | 128% |
Each 10 points of exception rate is 1,200 invoices a year that take 28 more minutes each: 30 instead of 2. That is 560 hours, or $27,227 a year at the loaded rate. No cost lever moves AP automation ROI that far. A running cost 25% lower saves $4,500 a year, and losing every discount costs $5,000.
The same 560 hours do not buy the same number of months. Each 10 points takes $2,269 off the full-speed monthly net: $5,723 at 20%, $3,455 at 30%, $1,186 at 40%. Payback is roughly the money to win back divided by that net, so it stretches faster as the net shrinks. Above about 45%, savings no longer cover the $1,500 running cost, and payback never comes.
After go-live, exceptions are most of the work left: 6 of the 7.6 minutes per invoice in the base case. At 40%, the automated desk spends $10.70 per invoice, close to today’s $12.97.
The rate can also rise after go-live. A strict match flags every rounding difference and small fuel charge that clerks used to wave through. Receipts posted two days late make good invoices fail.
It can fall, too. Ardent’s Best-in-Class teams run exception rates 47% lower than the rest of the market and process more than 1.8 times as many invoices straight through.2 That gap is about the step from the chart’s 20% line to its 10% line.
What moves the exception rate in a plant
Tolerances decide what counts as an exception. In Microsoft Dynamics 365 Finance, three-way matching compares invoice prices with the PO and invoice quantities with the product receipts. Price tolerance percentages can be set per item, vendor, item-and-vendor pair or legal entity.3
If your quality lab inspects incoming parts, Oracle Payables offers four-way matching: the billed quantity must not exceed the quantity accepted. An invoice that fails goes on a matching hold, which someone must release before payment.4
Most of the causes below start outside AP, at the purchasing desk or the receiving dock. AP teams spend 21.9% of staff time dealing with suppliers, which Ardent says “is in no small part caused by exceptions.”2
| Exception | Typical cause in a plant | What software can do | What a person decides |
|---|---|---|---|
| Partial receipt | Backorders and split shipments | Match against every receipt on the PO line; hold the rest until the next receipt posts | Short-pay or wait; ask for a corrected invoice or credit |
| Price variance | Stale PO price: expired quote, metals surcharge, distributor price change | Accept small differences within tolerance; send larger ones to the buyer | The buyer accepts the price and updates the PO, or disputes it |
| Quantity variance | Over-shipment of bar stock or wire sold by weight or length | Apply a per-item over-delivery tolerance; flag billed quantities above the receipt | Keep the extra, return it, or ask for a credit |
| Freight and surcharges | Freight, fuel or small-order fees not on the PO | Accept charges below a set amount and code them to the right account | Dispute surprise charges; agree freight terms with the supplier |
| Unit-of-measure mismatch | Resistors for the surface-mount line ordered in pieces, billed in reels; bar ordered in feet, billed by the pound | Convert with factors from the item or vendor master; flag lines with no factor | Keep the factors current; confirm odd units with the supplier |
| Missing goods receipt | Parts arrived, but the packing slip sits in a tray at the dock | Hold the invoice, recheck daily, and remind receiving with the PO number | Receiving posts the receipt; AP chases goods that never came |
Software finds, sorts and routes these exceptions, but a person still decides most of them. So the rate falls only when causes are fixed where they start. Update PO prices when quotes and surcharges change, load unit conversions into the item master, and post receipts the day goods arrive.
Give every exception a reason code and an owner, and review counts by supplier and cause each week. The same data can feed a procurement analytics dashboard.
Costs people leave out
Four costs are easy to miss. The base case prices the first three into its one-time cost. The fourth, time from buyers and the dock, sits outside the model, so exceptions cost more than it shows.
- ERP integration. The tool must read open POs and receipts and post approved invoices back, through a direct connection or scheduled file imports. Test it on a month of real invoices, and again after each ERP upgrade.
- Vendor master cleanup. Duplicate suppliers, old remit-to addresses, wrong payment terms and missing unit conversions all break matching. Confirm any change to supplier bank details by phone, with a contact you already know.
- Supplier onboarding. Suppliers must send invoices to one inbox or portal in a readable format. Ardent found that 57% of suppliers can now send invoices electronically, so plan for paper and scans from the rest.2
- The exception queue. Exceptions need a daily owner and quick answers from buyers and the dock. The discount window is 10 days, and Ardent’s average processing time is already 8.2 days.2 A price question that sits in a buyer’s inbox for a week loses the discount.
Before you talk to a vendor, measure two numbers from a two-week time log: your exception rate by cause, and the minutes per clean invoice and per exception. In this model, a 10-point miss on the exception rate delays payback more than a 50% overrun on the build or the running cost.
Footnotes
-
U.S. Bureau of Labor Statistics, “Employer Costs for Employee Compensation – June 2026”, Table 4, Private industry workers by occupational and industry group (released September 9, 2026), 2026. https://www.bls.gov/news.release/ecec.t04.htm ↩
-
Ardent Partners, “State of ePayables (Part Nine): AP Benchmarks and Best-in-Class Performance” (from the report The State of ePayables 2025: AP’s Unfinished Journey, published January 22, 2026), 2026. https://payablesplace.ardentpartners.com/2026/01/state-of-epayables-part-nine-ap-benchmarks-and-best-in-class-performance/ ↩ ↩2 ↩3 ↩4 ↩5 ↩6
-
Microsoft, “Accounts payable invoice matching overview”, Dynamics 365 Finance documentation (last updated May 15, 2025), 2025. https://learn.microsoft.com/en-us/dynamics365/finance/accounts-payable/accounts-payable-invoice-matching ↩
-
Oracle, “Two-, Three-, and Four-way Matching”, Oracle Payables Help, undated. https://docs.oracle.com/cd/A60725_05/html/comnls/us/ap/point04.htm ↩