
To automate production reports from ERP (enterprise resource planning) exports, start at the end. Define the finished report, then trace every number on it to an export, its columns and one written rule. This guide does that for one daily production report from ERP exports.
What the finished report shows
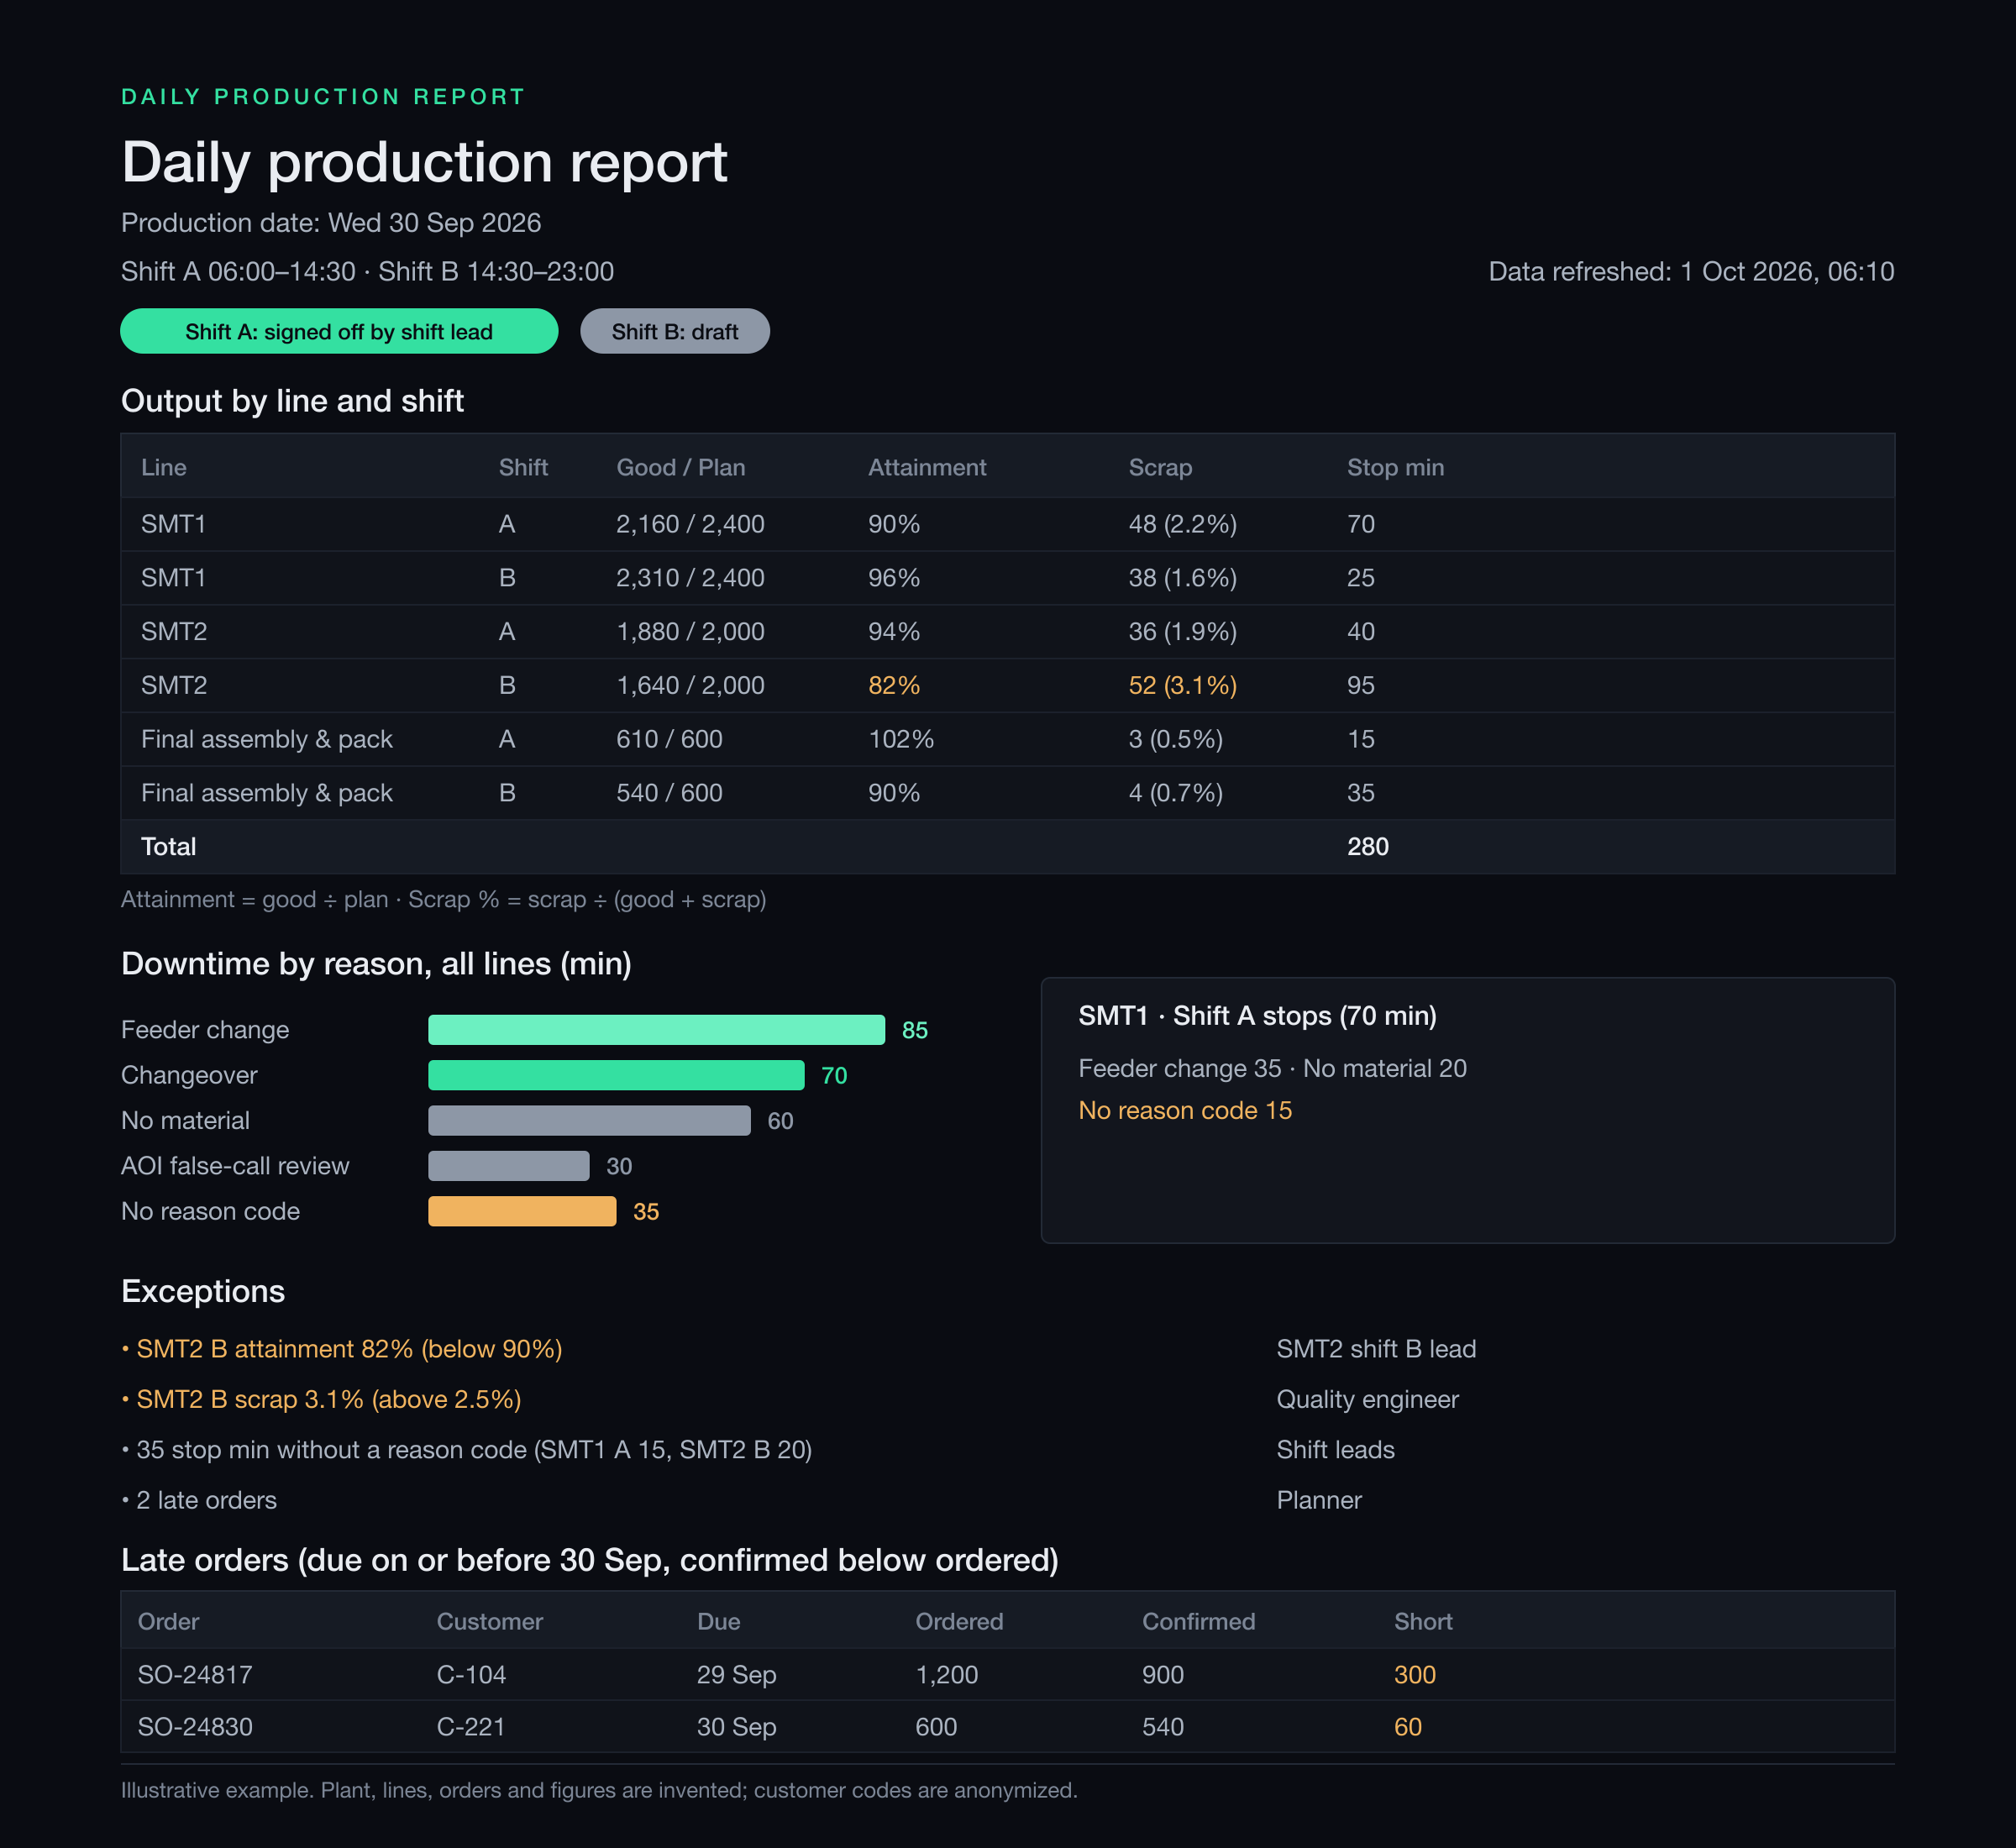
The report above is an illustrative example from a plant with two SMT (surface-mount technology) lines and a final assembly and pack line; every number on it is an assumption. It covers Wednesday 30 September 2026 and two shifts: A from 06:00 to 14:30 and B from 14:30 to 23:00.
- Header: production date, shift times, refresh time (1 October, 06:10) and sign-off: shift A signed off by its shift lead, shift B still a draft.
- Output by line and shift: good against plan, attainment, scrap count and scrap %, and stop minutes. SMT1 shift A made 2,160 good units against a plan of 2,400 (90%), scrapped 48 (2.2%) and lost 70 minutes to stops.
- Downtime by reason: 280 minutes in total, split into feeder change 85, changeover 70, no material 60, AOI (automated optical inspection) false-call review 30 and no reason code 35. A detail panel splits SMT1 shift A’s 70: feeder change 35, no material 20, no reason code 15.
- Exceptions and late orders: four exceptions, each with an owner, and two customer orders that are due and still short.
The report prints its definitions: attainment = good ÷ plan, and scrap % = scrap ÷ (good + scrap).
Where each number comes from
Every field traces to a source, its columns and one rule. Write this mapping first: in any production data analytics project, a dashboard cannot fix a number nobody defined.
| Report field | Source | Columns | Rule |
|---|---|---|---|
| Production date, shift | Shift calendar | shift, start, end | A 06:00–14:30, B 14:30–23:00 |
| Good, scrap | Production confirmations | line, finish time, good qty, scrap qty | Sum per line and shift |
| Plan | Plan table | line, shift, planned qty | One row per line and shift |
| Attainment, scrap % | Output row | good, plan, scrap | Good ÷ plan; scrap ÷ (good + scrap) |
| Stop minutes | Downtime log | line, start, end, minutes | Split at the shift change; sum per line and shift |
| Downtime by reason | Downtime log | reason code, minutes | Sum per reason; a blank code is “no reason code” |
| Late orders | Open orders | order, customer, due date, order qty, confirmed qty | Due on or before the production date, and confirmed qty below order qty |
The shift calendar and the plan table are not exports: you keep them yourself.
How the three exports fit together
Each export has a grain: what one row stands for. The grain decides which joins are safe.
- Production confirmations, a daily CSV (comma-separated values) file from the ERP: one row per confirmation, meaning one order’s good and scrap quantity on one line. Keys: confirmation ID, order, part and line, plus a finish time.
- Open orders, also from the ERP: one row per customer order not yet fully confirmed. Keys: order and customer; no line, no shift.
- Downtime log, typed on a tablet at each line: one row per stop. Keys: line, plus start and end times. No order or part: operators log stops against the line.
Confirmations and the downtime log share only line and shift, and shift must be derived from a time. Assign each confirmation by its finish time. With no night shift, a finish between 23:00 and 06:00 belongs to the shift B that just ended. Split a stop that crosses 14:30: one from 14:15 to 14:45 counts 15 minutes in each shift.
Import keys as text, through Power Query or code. When Excel opens a CSV file, by default it removes leading zeros, cuts long numbers to 15 digits and turns some codes into dates.1 Part 004512 becomes 4512, and lookups on it stop matching.
The join that doubles downtime, and the fix
The tempting build is one wide table: confirmations joined to open orders on order number, then to the downtime log on line and shift. The log has no order or part keys, so this join copies stops.
SMT1 shift A ran two orders, so it has two confirmation rows. A row-level join attaches each of the shift’s stops to both. The 20-minute no-material stop shows as 40 minutes, and the shift’s 70 stop minutes become 140. Nothing raises an error; with three orders, downtime would triple.
The fix is to aggregate first, then join the summaries:
- Sum the downtime log to line × shift × reason for the reason chart, and to line × shift for the output table.
- Sum the confirmations to line × shift.
- Join the two summaries on line + shift, starting from the plan table, which has one row per line and shift.
Each join is now one-to-one, so nothing is copied, and a line that made nothing still appears. Open orders feed only the late-order list and never meet the downtime log. Here is the downtime half in M, Power Query’s formula language.
// Output already has one row per line and shift: plan, good, scrap
Stops  = Table.Group(Downtime, {"Line", "Shift"},
             {{"StopMin", each List.Sum([Minutes]), type number}}),
Report = Table.ExpandTableColumn(Table.NestedJoin(Output, {"Line", "Shift"},
             Stops, {"Line", "Shift"}, "S", JoinKind.LeftOuter), "S", {"StopMin"})
Then stop the refresh if totals disagree: report stop minutes must equal the downtime log’s total, 280 here, and good output the confirmations total.
The rules for exceptions and late orders
An exception is something a named person must act on today. The report uses four rules, each with an owner:
- Attainment below 90% goes to the shift lead of that line and shift: SMT2 shift B, at 82%.
- Scrap above 2.5% goes to the quality engineer: SMT2 shift B, at 3.1%.
- Stop minutes without a reason code go to the shift leads: 35 minutes, 15 on SMT1 shift A and 20 on SMT2 shift B.
- Any late order goes to the planner: two orders.
Compare unrounded values against strict thresholds. SMT1 shift A and final assembly and pack shift B sit at exactly 90%, so they do not trigger. A shift at 89.6% prints as 90% but does trigger.
A late order is due on or before the production date and has a confirmed quantity below the order quantity. On 30 September two orders qualify (customer codes are anonymized):
- SO-24817, customer C-104, due 29 September: 900 of 1,200 confirmed, 300 short.
- SO-24830, customer C-221, due 30 September: 540 of 600 confirmed, 60 short.
The rule needs the open-orders export, which lists every order not yet fully confirmed. A late order nobody worked on that day has no confirmation row, so a list built from the day’s confirmations would miss it. In an Excel table of open orders, with the production date in a cell named ProdDate, the flag and the shortfall take one formula each.
Late flag:  =AND([@DueDate]<=ProdDate, [@ConfirmedQty]<[@OrderQty])
Short qty:  =[@OrderQty]-[@ConfirmedQty]
Refresh and sign-off
The header prints the refresh time, 06:10 on 1 October; add the newest record in each export. A downtime log ending at 18:00 means shift B’s stops are incomplete. A missing log shows zero stops, which looks like a good day, so stop the refresh instead.
A shift lead signs a shift off after checking its rows. Shift A is signed, so its numbers are final; shift B is still a draft and can change. Sign-off confirms counts, not reason codes: SMT1 shift A’s 15 uncoded minutes stay on the exception list. Store each sign-off (shift, name, time) in a sheet the report reads.
For production report automation in Excel, Power Query is enough for one plant and one report owner. It saves your steps as a query you refresh, and the same engine runs in Power BI.2 Excel can refresh a query when the file opens or every set number of minutes,3 so something must open the file. A scheduled Python script needs no open file and suits larger exports or several plants.
The report can also be a web page: the automated reporting workflow example is a live tool that turns an Excel dataset into a manager-ready report. Manufacturing analytics for small plants covers when to move beyond Excel.
When the report breaks
Make the report fail loudly: stop and say why rather than publish wrong numbers.
- A renamed or moved column. Read columns by name and check headers on every run. Stop with a message naming any missing column.
- A different unit. If SMT1 confirmed panels of four boards (an assumption) while the plan counts boards, shift A’s attainment would read 22.5%, not 90%. Keep a unit table per part.
- A duplicate or reversed confirmation. One order posted twice adds its quantity again. Keep one row per confirmation ID, and net a reversal against its original.
- A clock change. US clocks jump from 2 a.m. to 3 a.m. on the second Sunday in March and fall back on the first Sunday in November.4 If the ERP exports UTC (Coordinated Universal Time) and the query adds a fixed offset, an hour of postings lands in the wrong shift for part of the year. Use a named time zone such as America/Chicago.
- A schedule that switched itself off. Power BI turns off a refresh schedule after four failures in a row.5 Send every failure alert to a person.
Before you retire the hand-built report, run both side by side for a week or two and explain every difference.
Footnotes
-
Microsoft Support, “Set automatic data conversions”, 2026 (checked October 2026). https://support.microsoft.com/en-us/excel/set-automatic-data-conversions ↩
-
Microsoft Learn, “What is Power Query?”, 2026 (checked October 2026). https://learn.microsoft.com/en-us/power-query/power-query-what-is-power-query ↩
-
Microsoft Support, “Refresh an external data connection in Excel”, 2026 (checked October 2026). https://support.microsoft.com/en-us/excel/refresh-an-external-data-connection-in-excel ↩
-
NIST, “Local Time FAQs”, 2026 (checked October 2026). https://www.nist.gov/pml/time-and-frequency-division/local-time-faqs ↩
-
Microsoft Learn, “Configure scheduled refresh”, 2026 (checked October 2026). https://learn.microsoft.com/en-us/power-bi/connect-data/refresh-scheduled-refresh ↩